
Table of Contents
Executive Summary
The 2026 FIFA World Cup was the largest sporting event in history, spanning three countries, 16 host cities, and 104 matches over 39 days. For the short-term rental industry, the tournament generated extraordinary pricing power, with average daily rates soaring across all host markets. However, occupancy results were mixed, revealing that this was largely a price event rather than a crowd event. International travel barriers, visa restrictions, and high transportation costs limited the expected surge in global visitors, while domestic demand drove most of the bookings.
STR Performance Snapshot
The World Cup Effect: $1.33 Billion in Short-Term Rental Revenue
🌎 3 host countries, 16 cities, 104 matches, 39 days
💰 $1.33 billion total short-term rental revenue across 16 host cities
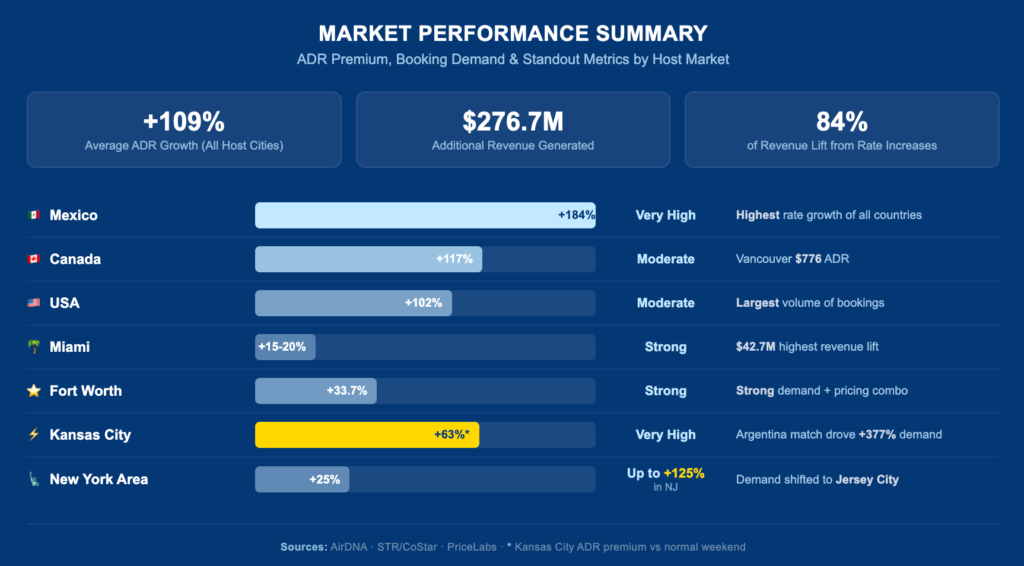
📈 $276.7 million additional revenue generated vs. 2025
🏠 $212 million in host earnings on Airbnb alone
🌍 $1.2 billion total spending by Airbnb guests
📊 +43% revenue per listing
📈 ADR increased +109% across all 16 host cities
⚽ Only 1 of 16 host cities grew occupancy: Guadalajara
Airbnb FIFA World Cup 2026: What the Tournament Revealed About the Vacation Rental Market
The Airbnb FIFA World Cup 2026 was more than the biggest football tournament ever played. It also became one of the most significant demand drivers the vacation rental industry has seen in recent years.
Across the 39-day tournament, short-term rental markets in the United States, Mexico, and Canada experienced remarkable growth. Average daily rates (ADR) increased by 109% across all 16 host cities, while Mexico led the way with an impressive 184% year-over-year increase.
For property managers, the tournament offered valuable insights into pricing strategies, guest behavior, and operational readiness during periods of exceptional demand. Here’s what the numbers revealed.
How the 2026 FIFA World Cup Reshaped the Short-Term Rental Market
The 2026 edition was historic in every sense. It was the first FIFA World Cup hosted by three countries, expanded to 48 national teams, and featured a record 104 matches.
That larger format translated directly into more travelers, longer booking windows and sustained demand across host destinations, creating new opportunities for vacation rental owners and property managers.
The World Cup 2026 short-term rentals market changed the way demand moved across North America’s vacation rental industry. With 104 matches played over 39 days in 16 host cities, the tournament generated sustained booking activity instead of isolated peaks.
Unlike previous editions, demand was distributed across three countries, creating different performance patterns depending on local supply, pricing strategies, and visitor volume. While some cities experienced moderate increases, others saw ADR multiply several times over compared to the previous year.
For vacation rental professionals, the tournament became a real-world example of how global events can reshape pricing, occupancy, and operational planning.
How Demand Evolved Throughout the Tournament
Demand didn’t peak only when matches were played. Instead, booking activity remained strong throughout the entire tournament window, with travelers arriving early, extending their stays, and moving between host cities.
Some destinations experienced extraordinary pricing increases, particularly in markets with limited inventory, while larger cities such as New York, Miami, and Los Angeles absorbed demand more evenly thanks to their greater accommodation supply. The result was a tournament that demonstrated how inventory availability, rather than popularity alone, played a decisive role in shaping vacation rental performance.
Top Performing Cities
City Spotlights
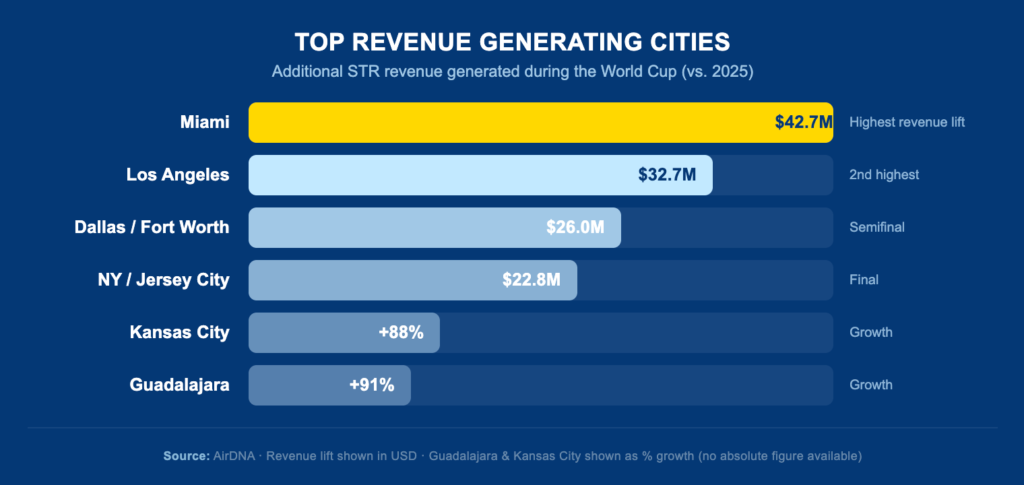
Kansas City: The Argentina Effect
- +377% demand spike during Argentina match (Axios)
- +63% ADR premium vs normal weekend
- +88% total revenue growth YoY
- Only 1,676 active listings (supply-constrained)
- Quarterfinal (Argentina): 75% occupancy, +54% ADR
New York / New Jersey: The Final & The Regulatory Divide
- NYC regulations diverted demand to Jersey City (+125% on match days)
- Paterson: +175% bookings during Final weekend (New York Post)
- Combined revenue lift: $22.8M (AirDNA)
- Final night: Jersey City/Newark demand +45%, ADR +39%
- Final night: NYC occupancy 83%
Houston: When Expectations Didn’t Match Reality
- One of the most affordable host markets
- Rate increases up to +39% during key matches (Houston Chronicle)
- Round of 32 (Brazil vs Japan): -26.5 pp occupancy deficit (PriceLabs)
- 21% of bookings for round-of-32 came within 1 week
Boston: The Success Story
- Demand +9% over first two weeks (WBUR)
- Occupancy 81% (+5 pp vs 2025)
- ADR +25% (~$300-350/night)
- $57M in revenue during tournament
- +1,000 new listings absorbed
Atlanta: The Semifinal Surge
- Semifinal (England vs Argentina): demand +8% YoY (AirDNA)
- Last-minute bookings for the semifinal: +71% YoY
- Flight bookings Argentina → Atlanta: +108% ahead of the semifinal
Guadalajara: The Only City with Occupancy Growth
- Only host city with YoY occupancy growth
- Mexico vs South Korea: 45% → 71% occupancy (+26 pp)
- Revenue per listing: +368% (PriceLabs)
- Group-stage demand around game days: +94% YoY
Revenue, Occupancy & Market Performance by Country
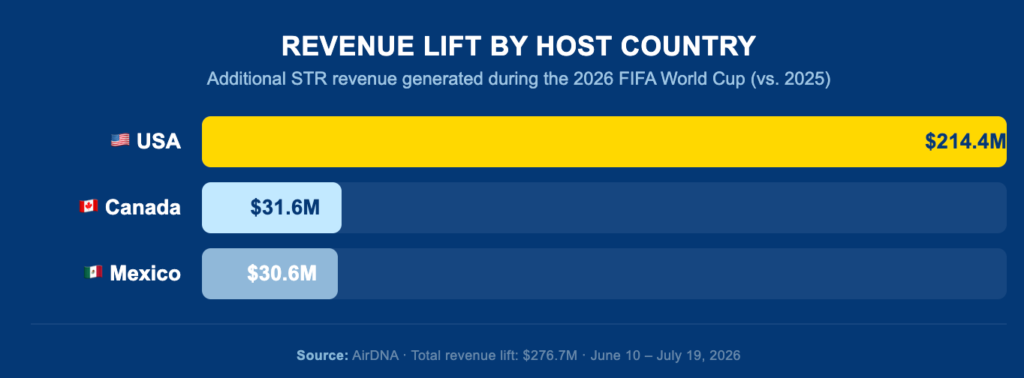
The 2026 FIFA World Cup generated $1.33 billion in total short-term rental revenue across all 16 host cities during the tournament window (June 10 – July 19, 2026), a 26% increase over the same period in 2025. That represents an additional $276.7 million in revenue compared to the previous year.
However, the way that revenue was earned tells a more nuanced story. Of the $276.7M revenue lift, $231.8M (84%) came from hosts commanding higher nightly rates. Additional nights booked contributed just $44.9M (16%). In every single host city, ADR premiums drove larger revenue gains than demand did.
Although the tournament generated strong demand across all three host nations, its impact was far from uniform. Local inventory, pricing strategies, and traveler preferences shaped how each market performed, with some destinations seeing steady growth and others experiencing extraordinary price surges.
Key insight: The World Cup was less a demand event than a pricing event.
United States
With 11 host cities, the United States welcomed the largest share of World Cup matches. Strong demand pushed ADRs significantly higher, although performance varied depending on local supply.
- ADR increased by 102% year over year, rising from $246 to $499 across U.S. host cities.
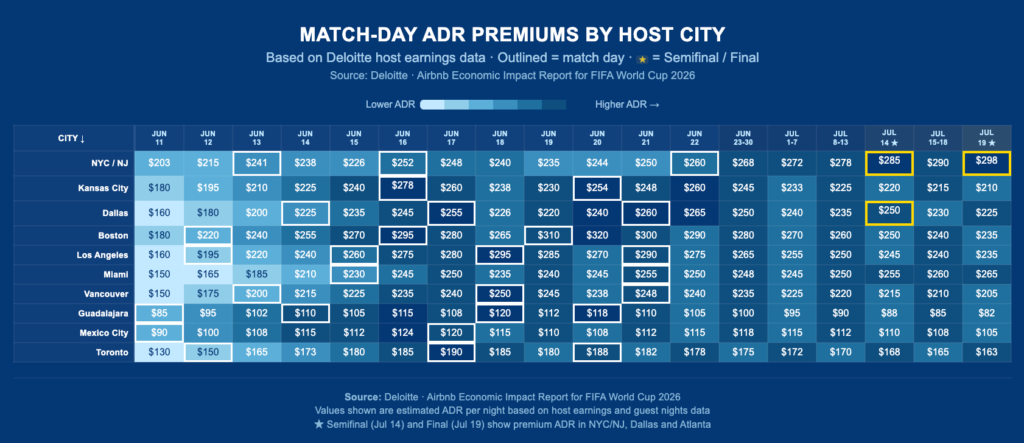
- Dallas and Kansas City recorded some of the tournament’s strongest price growth, with ADR increases of more than 238%.
- Dallas also posted the largest asking vs. booked gap (+126%), suggesting many hosts priced inventory well above confirmed booking rates.
- Larger markets such as New York, Miami and Los Angeles experienced steadier pricing thanks to their larger accommodation supply.
- Even on non-match days, most U.S. host cities maintained elevated ADRs throughout the tournament window.
Mexico
Mexico emerged as the tournament’s standout performer. Although it hosted only three cities, limited inventory and strong international demand generated the highest regional price increases.
- ADR surged 184% year over year, the largest increase among all host countries.
- Monterrey recorded the highest average match day premium at 349%, with one match reaching an extraordinary 387% increase.
- Guadalajara consistently ranked among the strongest performing markets, with match day premiums regularly exceeding 250%.
- Mexico City combined strong demand with some of the tournament’s most affordable accommodation options, creating attractive value for travelers.
- The country’s combination of limited supply and high demand created some of the most competitive vacation rental markets during the World Cup.
Canada
Canada hosted fewer matches than the United States but still delivered impressive growth, particularly in Vancouver.
- ADR increased by 117% year over year, climbing from $256 to $556.
- Vancouver became one of the tournament’s highest-priced destinations, with ADR reaching $776 during the event window.
- Match day premiums in Vancouver frequently exceeded 190%, reflecting strong and consistent demand.
- Toronto experienced more moderate growth, with stable pricing throughout most of the tournament.
- Canada’s balanced supply helped absorb demand without experiencing the extreme pricing volatility seen in several U.S. and Mexican host cities.
World Cup 2026 Short-Term Rentals: Which Host Cities Delivered the Strongest Performance?
Booking Channels & Search Demand
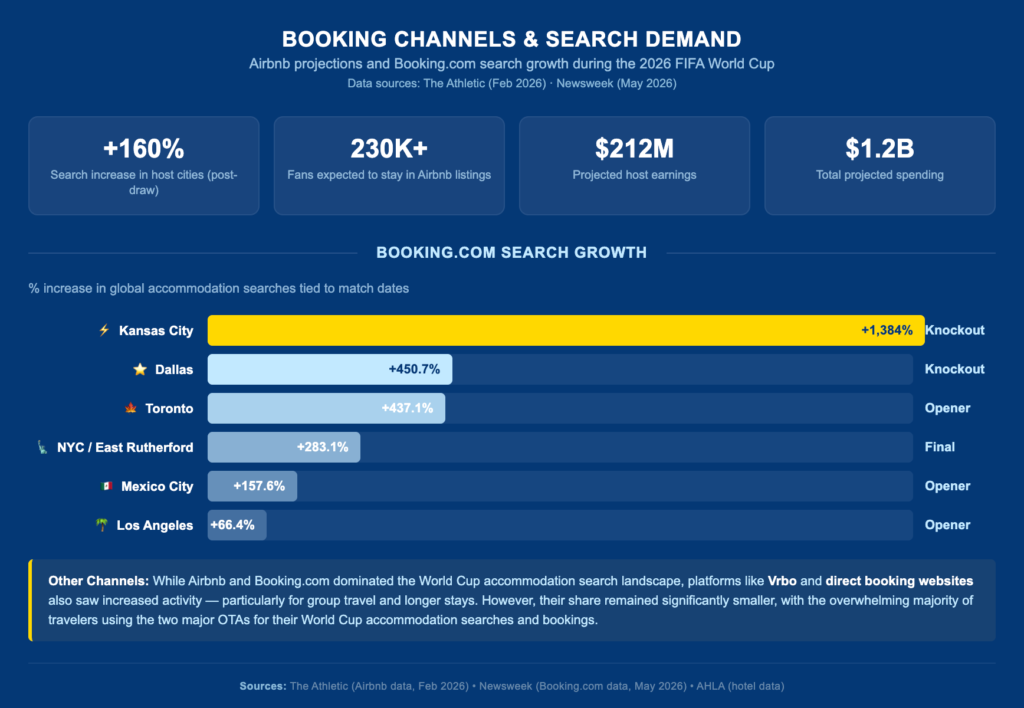
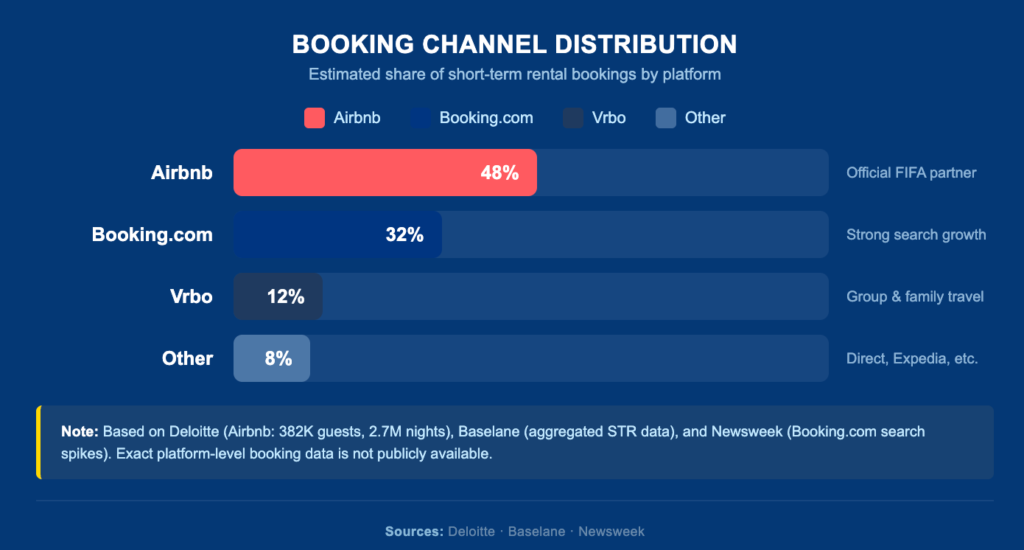
The 2026 FIFA World Cup generated unprecedented search and booking activity across online travel agencies. Both Airbnb and Booking.com reported significant spikes in accommodation searches tied to specific match dates, with some markets seeing increases of over 1,000%.
Airbnb, an official FIFA partner, projected that more than 230,000 fans would stay in Airbnb listings across North America during the tournament, generating $212 million in host earnings and $1.2 billion in total spending, according to a Deloitte study commissioned by the platform. The company also reported a 160% increase in searches in host cities immediately following the World Cup draw.
However, the data also reveals a growing divide: while short-term rental platforms are benefiting from group travel and flexible pricing, hotels are reporting “weaker than expected” bookings. According to the American Hotel & Lodging Association (AHLA), 80% of hotels reported bookings below expectations, with domestic travelers outpacing international visitors due to visa restrictions and rising costs.
Booking Window: How Far in Advance Did Guests Book?
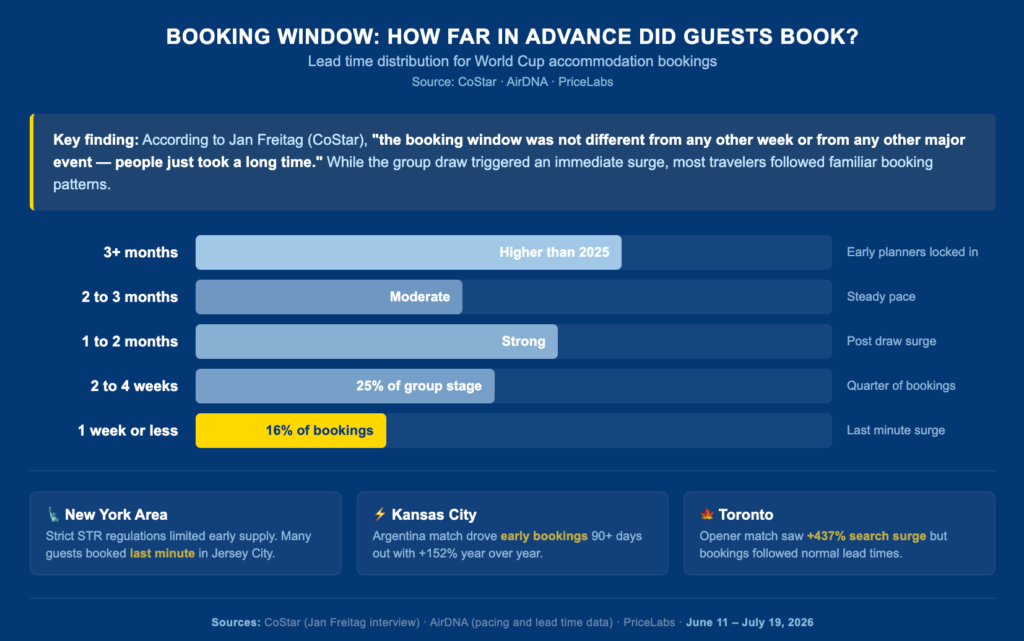
One of the most surprising findings from the 2026 FIFA World Cup was that the booking window did not change as dramatically as many expected. According to Jan Freitag, National Director of Hospitality Analytics at CoStar Group, “I was super surprised that the booking window did not change as much as I thought it should. A lot of reporters we talked to were like, ‘Oh my God, does that mean nobody’s coming?’ It turns out that the booking window was not different from any other week or from any other major event — people just took a long time.”
However, the data tells a more nuanced story. According to some post-tournament studies, a quarter of all group-stage bookings landed within two weeks of the stay, with 16% coming inside a single week. At the same time, a larger share of bookings than the previous year came more than three months out, as fans either locked in early or waited on the bracket.
The knockout rounds compressed booking windows even further. In Houston, 21% of bookings for the Round of 32 match came within a week of the stay, up from 16% for the same dates a year earlier. When the bracket cleared on July 15, Argentina fans had to make their way to New Jersey for the Final; flight bookings from Argentina to Atlanta jumped 108% ahead of the semifinal, but bookings to New York for the Final lagged until the matchup was confirmed.
How Technology Helped Property Managers Keep Up with Demand
The 2026 FIFA World Cup was a real-world stress test for the short-term rental industry. Across 16 host cities, 104 matches, and 39 days of competition, property managers who embraced technology, automation, and data-driven decision-making consistently outperformed those who relied on static strategies. Here are the most important takeaways from the tournament.
Technology Is No Longer Optional
The numbers were clear: across all 16 host cities, 84% of the $276.7M revenue lift came from rate increases, not additional bookings. Capturing that value required real-time pricing adjustments that manual processes simply cannot match. Property managers who relied on static pricing or manual calendar management missed the window and left revenue on the table. Those who automated their operations captured the premium, even when occupancy didn’t materialize as expected.
Managing Multiple Booking Channels
The tournament created one of the most competitive booking environments the industry has ever seen. With millions of international travelers searching across Airbnb, Booking.com, Vrbo, and direct booking websites, property managers could no longer rely on a single distribution channel.
Managing availability manually became increasingly difficult as demand shifted rapidly between host cities and match dates. According to PriceLabs’ FIFA World Cup 2026 Playbook, revenue managers were encouraged to publish calendars well in advance and continuously adjust pricing as booking patterns evolved.
Distributing listings across multiple OTAs captured demand from different traveler segments rather than depending on one marketplace. A centralized property management system with channel management capabilities became essential for preventing double bookings, synchronizing calendars in real time, and maintaining consistent pricing across every booking channel during periods of extreme demand.
Automating Guest Communication and Operations
The tournament attracted an unprecedented volume of international travelers, bringing higher inquiry volumes, multilingual communication, and more operational complexity for property managers. According to Enso Connect’s FIFA World Cup 2026 Revenue Playbook, automation played a critical role in maintaining guest satisfaction without increasing operational workload. AI-powered messaging, automated check-in instructions, digital guest portals, and scheduled communications allowed managers to respond around the clock while reducing manual tasks.
Successful operators automated operational workflows beyond messaging. When guests purchased services such as early check-in, late checkout, or mid-stay cleaning, automated workflows instantly updated housekeeping schedules without requiring manual coordination. Beyond operational efficiency, automated upsell strategies generated an additional $50 to $150 per booking, while ancillary revenue increased overall property revenue by 8% to 30%.
Pricing is an important advantage
Pricing was one of the biggest competitive advantages during the World Cup, but experts consistently warned against relying on fixed rates during a period of rapidly changing demand. Technology allowed property managers to analyze market trends, monitor competitor activity, and adjust rates based on booking pace, availability, and demand signals.
Dynamic pricing tools helped operators identify high-value opportunities while avoiding overpricing that could reduce occupancy. Instead of focusing only on increasing nightly rates, successful managers optimized overall revenue by balancing pricing, minimum stays, and calendar availability. Data-driven decisions helped them capture peak demand while keeping their listings competitive throughout the tournament.
For a complete breakdown of how to implement these strategies across your entire portfolio, read our detailed guide on How to Optimise Airbnb Pricing Using Property Management Software.
What Property Managers Can Learn from the 2026 FIFA World Cup
Lessons for Future High-Demand Events
Large events generate opportunities, but they also magnify operational problems. A single mistake, such as a double booking or delayed guest response, can quickly affect reviews, revenue, and your team’s workload.
Property managers can prepare by focusing on several key areas:
- Keep calendars synchronized across every booking channel to eliminate double bookings.
- Automate guest communication before, during, and after each stay.
- Adjust pricing dynamically as demand increases.
- Coordinate cleaning and maintenance with real-time scheduling.
- Centralize reservations, payments, and guest information in one platform.
For a deeper dive into how automation and optimization strategies can directly increase your booking performance, check out our guide on How to Improve Airbnb Bookings Using Property Management Software.
Key Lessons from the World Cup 2026 for Property Managers
The 2026 FIFA World Cup was a real-world stress test for the short-term rental industry. Across 16 host cities, 104 matches, and 39 days of competition, property managers who embraced technology, automation, and data-driven decision-making consistently outperformed those who relied on static strategies. Here are the most important takeaways from the tournament.
LESSON 1: Technology Is No Longer Optional
“Operators with automated workflows were able to manage increased demand more efficiently while reducing manual tasks.”
What the data showed:
- During the World Cup, 84% of the $276.7M revenue lift came from rate increases, not additional bookings. Capturing that value required real-time pricing adjustments that manual processes simply cannot match.
- In Kansas City, the Argentina match alone pushed occupancy from 3% to 33% overnight, a demand shock that required immediate operational response.
- Cities like Boston (+60.2% pacing surge) and Dallas (+57.6%) saw booking windows compress dramatically after the December 5 draw. Property managers with automated calendars and instant booking capabilities captured the early wave.
The takeaway: Without automation, you cannot react fast enough to capture peak demand or avoid costly mistakes like double bookings.
LESSON 2: Dynamic Pricing Became Essential
“Dynamic pricing proved significantly more effective than static seasonal pricing during periods of exceptional demand.”
What the data showed:
- Hosts who repriced aggressively captured the premium. Arlington led with a +46.5% increase in listed rates, followed by Dallas (+33.7%) and Kansas City (+25.4%).
- In Guadalajara, the Mexico vs. South Korea match drove occupancy from 45% to 71% (+26 percentage points), and revenue per listing rose 368%, a clear signal that dynamic, event-based pricing works.
- Cities that barely moved on pricing, San Francisco (+0.1%), Los Angeles (+4.0%), left significant revenue on the table, despite hosting marquee matches at SoFi Stadium and Levi’s Stadium.
The takeaway: Static seasonal pricing is obsolete for major events. Data-driven dynamic pricing allows you to capture the premium when demand spikes, and adjust when it doesn’t.
LESSON 3: Distribution Matters
“Property managers connected to multiple OTAs reached a broader audience and captured bookings from international travelers using different platforms.”
What the data showed:
- Airbnb projected 230,000+ fans staying in Airbnb listings across North America, with $212M in projected host earnings and $1.2B in total spending.
- Booking.com search data showed massive spikes in host cities, Kansas City (+1,384%), Dallas (+450.7%), and Toronto (+437.1%), indicating travelers were searching across multiple platforms.
- According to AHLA, 80% of hotels reported bookings below expectations, while short-term rentals captured a larger share of the accommodation market than anticipated.
The takeaway: Relying on a single OTA limits your visibility. Multi-channel distribution captures demand from different traveler segments and protects against platform-specific disruptions.
LESSON 4: Beyond the Host Cities
The tournament also benefited surrounding destinations.
Many travelers chose nearby cities because of:
- Lower accommodation prices – Non-host cities offered more affordable options
- Better availability – Host cities saw supply constraints
- Easier transportation – Proximity to stadiums without premium pricing
- Longer holiday itineraries – Travelers extended trips to explore multiple destinations
This demonstrated that major sporting events can positively impact an entire region, not just the cities hosting matches.
Key example: In the New York area, strict STR regulations in NYC diverted demand to Jersey City and Newark, where bookings increased up to 125% on match days. Paterson saw a +175% increase in bookings during the Final weekend.
LESSON 5: Guest Experience Remains a Competitive Advantage
“Fast communication, smooth check-ins, and efficient operations translated into stronger reviews and increased visibility on booking platforms.”
What the data showed:
- The tournament attracted an unprecedented volume of international travelers, bringing higher inquiry volumes and multilingual communication challenges.
- According to Enso Connect, automated upsell strategies generated $50 to $150 per booking, with ancillary revenue increasing overall property revenue by 8% to 30%.
- In markets like New York, strict STR regulations diverted demand to Jersey City and Newark, where bookings increased up to 125% on match days, highlighting that guests will choose properties with seamless booking experiences and clear communication.
The takeaway: In a high-demand environment, the guest experience differentiates your listing. Fast communication, clear check-in instructions, and automated workflows reduce friction and drive better reviews, which in turn improve visibility on booking platforms.
Building a More Resilient Rental Business
The performance of World Cup 2026 short-term rentals demonstrated that technology, automation, and centralized operations are no longer optional during periods of exceptional demand.
Peak seasons come and go, but the systems you build today will benefit your business all year long. Investing in automation allows property managers to scale confidently without increasing operational complexity.
With Hostify, property managers can prepare for high-demand periods by:
- Syncing availability and rates across 400+ booking channels in real time.
- Managing every guest conversation from one Unified Inbox.
- Automating repetitive tasks, including messaging, reviews, payments, and workflows.
- Monitoring occupancy, pricing, and reservations from a centralized Multi Calendar.
- Creating a commission-free booking website to increase direct reservations.
- Managing operations from anywhere using the Hostify mobile app.
Whether you’re preparing for the next global sporting event, a major festival, or your busiest holiday season, having the right property management software helps you stay organized, maximize occupancy, and deliver a consistently excellent guest experience.
If you’re looking to simplify operations before your next peak season, book a demo with Hostify and discover how automation can help your business grow without adding extra workload.
Conclusion
The 2026 FIFA World Cup was a stress test for the short-term rental industry, and the results were clear. Across 16 host cities, $276.7M in additional revenue was generated, but 84% of that gain came from higher rates, not more bookings. The tournament rewarded hosts who priced dynamically, automated their operations, and optimized their distribution. Those who relied on static strategies or manual processes left money on the table.
The next major event is always around the corner. Whether it’s the 2028 Los Angeles Olympics, the 2031 FIFA Women’s World Cup, or your city’s next big festival, apply the same principles.
Frequently Asked Questions
The United States recorded the highest vacation rental occupancy during the tournament, driven by the largest number of host cities and matches.
New York City generated the highest total vacation rental revenue during the tournament, driven by its enormous inventory of short-term rental properties, consistently strong demand, and its status as one of the tournament’s flagship destinations.
While other cities like Dallas and Vancouver achieved higher average nightly rates, New York’s sheer volume of listings translated into the largest overall revenue pool across all host cities.
Average Daily Rates (ADR) increased significantly across host cities, with many destinations experiencing double-digit growth as demand surged throughout the competition.
Most guests stayed between four and seven nights, although many international travelers extended their trips to visit multiple host cities.
The tournament showed the importance of dynamic pricing, automation, multi-channel distribution, and direct bookings.
Platforms like Hostify help property managers prepare for high-demand events by centralizing operations and automating daily tasks.