

Table of Contents
The short-term summer rentals market in 2026 is no longer a one-size-fits-all story. According to a recent regional analysis of consumer preferences across 26 European nations, affordability remains the top driver for choosing short-term rentals over hotels, cited by 62% of travelers overall. However, the data reveals sharp regional divides. While Southern and Eastern European travelers prioritize cost and authentic local experiences, Northern and Western European guests place greater emphasis on service quality, better facilities, and user-generated reviews as trust signals before booking their rentals.
The scale of the sector is staggering. Eurostat data shows that 951.6 million guest nights were booked through platforms like Airbnb, Booking, and Expedia across Europe in 2025, an 11.4% increase year-over-year and nearly double the 512 million recorded in 2019. France led with 213 million guest nights, followed by Spain (189M), Italy (139M), and Germany (68M). International visitors accounted for 62.2% of all platform-booked stays, with July and August alone concentrating one-third of annual demand.
Executive Summary
The short-term summer rentals market in 2026 is defined by scale, regional divergence, and premiumization. Global vacation rental revenue reached $101.37 billion, Europe remains the largest region at 33.89% of global revenue, and U.S. nights booked rose 5.5% year-over-year in January 2026. Pricing power is real but selective: luxury-tier ADRs grew 5.23% while budget-tier ADRs declined 0.33%.
Key data points:
- Global revenue 2026: $101.37B → $138.74B by 2035
- Europe guest nights 2025: 951.6M (+11.4% YoY)
- Global users 2026: 890M → 1.11B by 2030
- ADR forecast 2026: +1.5% (luxury +5.23%, budget -0.33%)
- Pet-friendly ADR premium: +$17.41 on average
- June fill rates: 53% Nags Head → 17% South Lake Tahoe
- Airbnb share: 46% | Direct bookings: 34%
- Fastest-growing segment: 6+ bedrooms (+12.61% YoY)
- World Cup 2026: 1.33Binrentalrevenue(+276.7M vs 2025)
- 84% of World Cup lift came from rate increases, not bookings
Key takeaways for hosts:
- Fast markets (>30% fill): hold or raise rates
- Slow markets (<20% fill): discount and shorten minimum stays
- Direct bookings = 45.2% longer stays
- Coastal books 90–120 days out; mountain <45 days
- Only 5.82% of rentals list on all major OTAs
Revenue & Pricing Performance
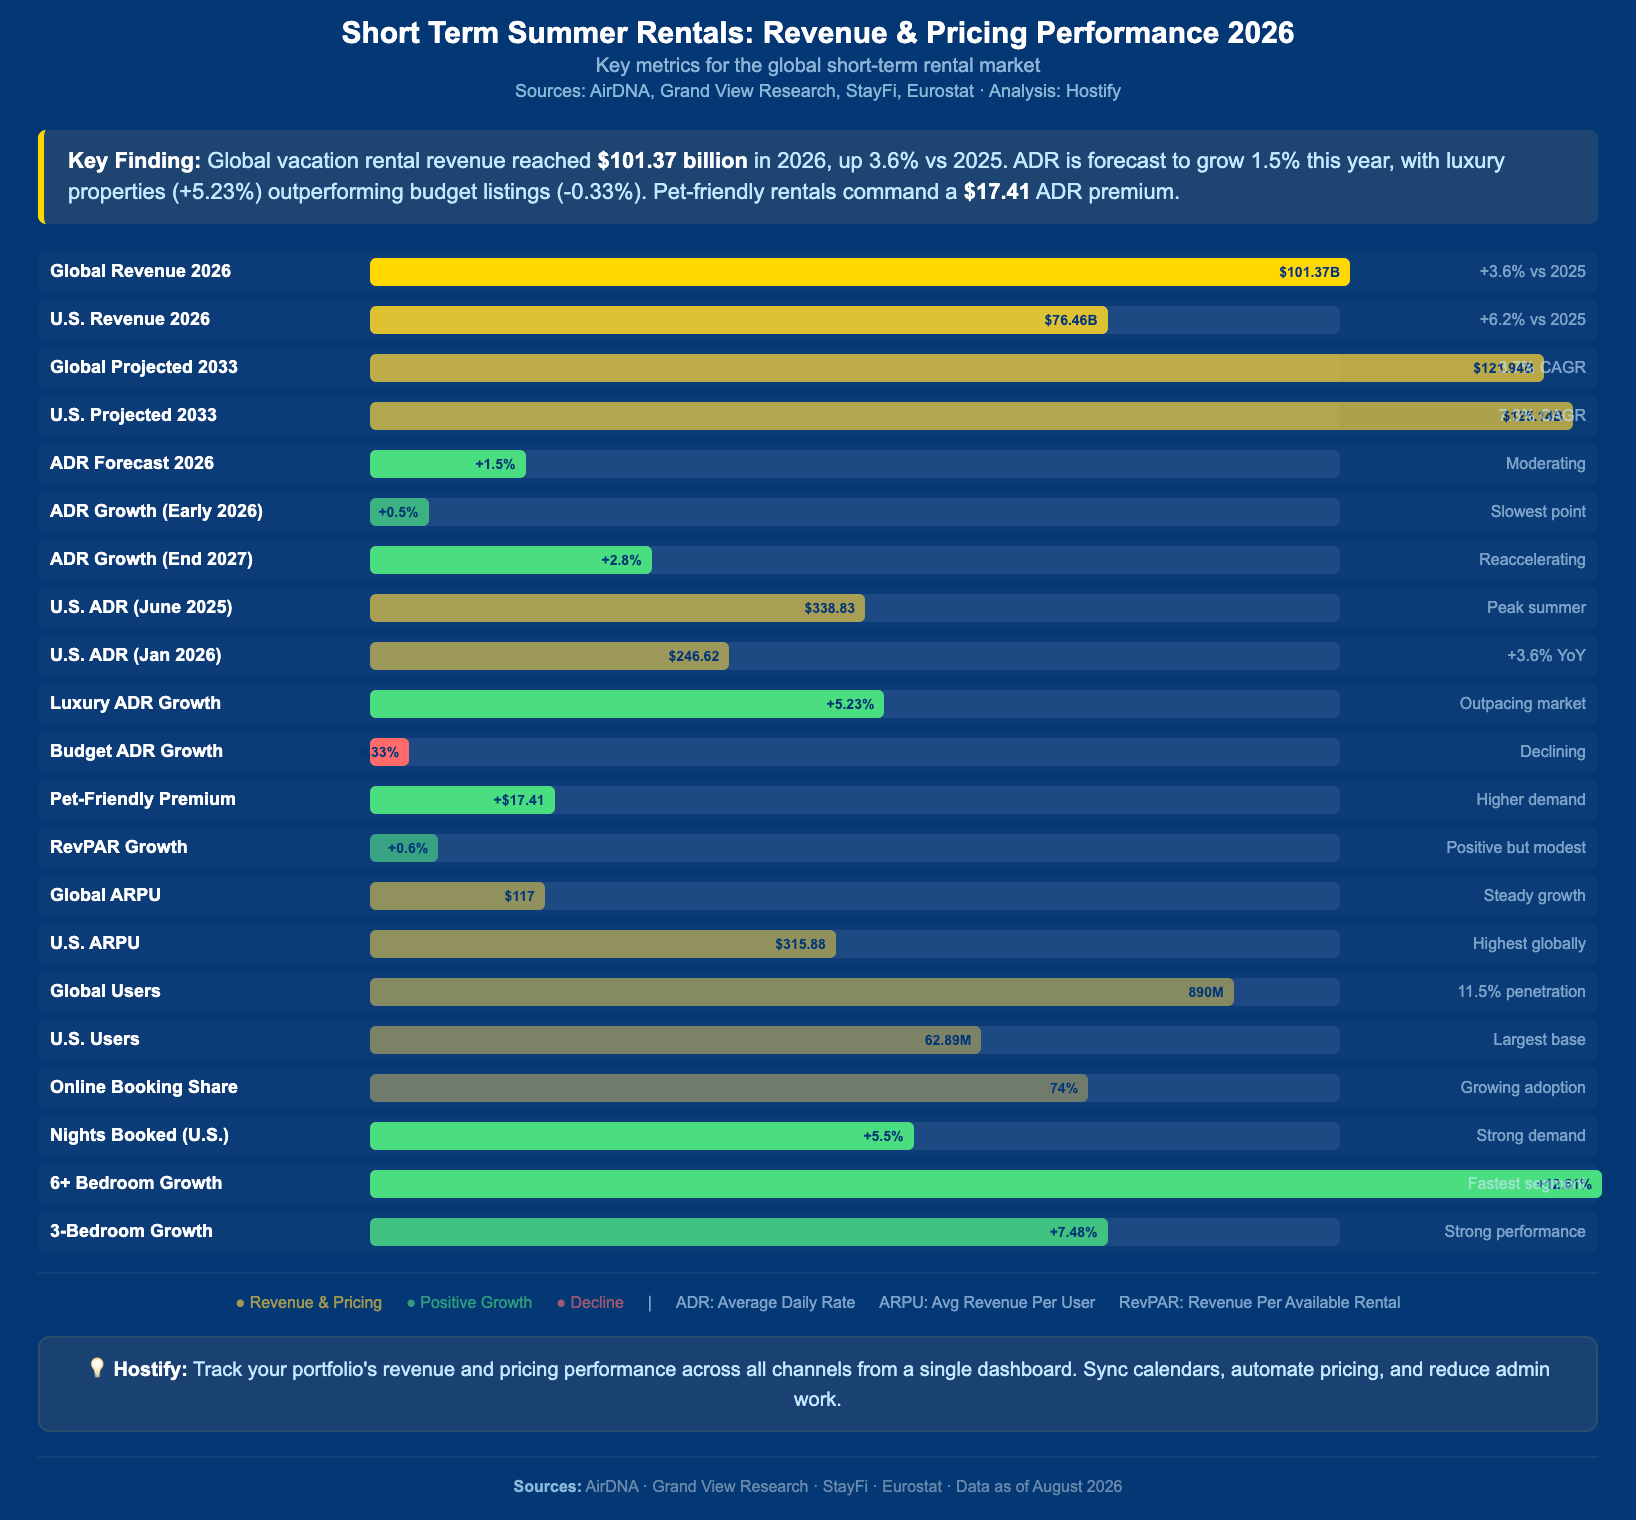
The short-term summer rentals market continued its upward trajectory in 2026, with global vacation rental revenue reaching $101.37 billion according to Grand View Research. While growth has moderated compared to the post-pandemic rebound, pricing power remains strong across most segments. The U.S. market alone is projected to generate $76.46 billion in 2026, up from $72.00 billion in 2025, reflecting a steady 7.3% CAGR through 2033. However, performance is increasingly selective. Occupancy is expected to ease by approximately 1% as available listings grow 4.6%, making revenue optimization more critical than ever for hosts and property managers.
Total Revenue Generated
Global vacation rental revenue reached $101.37 billion in 2026, with steady growth projected through 2035 when the market is expected to hit $138.74 billion. The U.S. remains the largest single-country market, generating $19.61 billion in 2026, followed by China at $13.33 billion and Japan at $6.42 billion.
For a deeper dive into the best U.S. markets, check out our guide on Vacation Rentals in USA: Best Markets for 2026 Investment. Europe continues to lead at the regional level, accounting for 33.89% of global revenue, while Asia Pacific is the fastest-growing region with a 3.1% CAGR from 2026 to 2033.
Key revenue data points for short-term summer rentals:
- Global vacation rental revenue in 2026: $101.37 billion
- Projected global revenue by 2033: $121.94 billion (3.7% CAGR)
- U.S. market revenue in 2026: $76.46 billion
- U.S. market projected by 2033: $125.14 billion (7.3% CAGR)
- Europe market revenue in 2025: $34.46 billion (largest regional market)
- Asia Pacific CAGR (2026–2033): 3.1% (fastest-growing region)
- RevPAR growth in 2026: +0.6% year-over-year
- Total nights booked in U.S. (January 2026): +5.5% year-over-year
- Luxury-tier properties driving ADR expansion: +5.23% year-over-year
- Pet-friendly rentals generating 5.4% more demand than non-pet listings
Average Daily Rate (ADR)
Average daily rates for short-term summer rentals are forecast to rise 1.5% in 2026, with pricing momentum recovering after a soft patch in late 2025. According to AirDNA, ADR growth is expected to slow to just +0.5% in early 2026 before reaccelerating to +2.8% year-over-year by the end of 2027 as inflation cools and consumer confidence improves. Luxury-tier properties are leading the charge with ADR growth of +5.23% year-over-year, while budget-tier ADRs have declined by 0.33%, highlighting a clear premiumization trend in the market. Pet-friendly rentals command an average of $17.41 higher ADR than comparable non-pet-friendly listings, and in top-tier markets, they can earn 12% to 90% more.
Key ADR data points for short-term summer rentals:
- ADR forecast growth in 2026: +1.5%
- ADR growth expected in early 2026: +0.5%
- ADR growth projected by end of 2027: +2.8%
- U.S. average ADR in June 2025: $338.83
- Luxury-tier ADR growth: +5.23% year-over-year
- Budget-tier ADR change: -0.33% year-over-year
- Pet-friendly ADR premium: +$17.41 on average
- Pet-friendly premium in top-tier markets: 12% to 90% more
- ADR climbed to $246.62 in January 2026 (up 3.6% year-over-year)
- Las Vegas ADR expected to recover to $242 in 2026
Average Spend Per Traveler
Global average revenue per user (ARPU) in the vacation rental market reached approximately $117 in 2024, according to Statista. In the U.S., ARPU is significantly higher at an estimated $315.88, reflecting the maturity and premium positioning of the American short-term rental market. The global user base for vacation rentals is estimated at 890 million in 2026, with projections reaching 1.11 billion by 2030, representing a user penetration rate of 13.6%.
Key spend per traveler data points for short-term summer rentals:
- Global ARPU in vacation rental market (2024): $117
- U.S. average ARPU (2024): $315.88
- Global vacation rental users in 2026: 890 million
- Projected users by 2030: 1.11 billion
- Global user penetration rate in 2026: 11.5%
- Projected penetration rate by 2030: 13.6%
- Online sales share in 2026: 74% of total bookings
- U.S. vacation rental users in 2026: 62.89 million
- Large homes (6+ bedrooms) saw fastest booking growth: +12.61% year-over-year
- Three-bedroom properties growth rate: +7.48% year-over-year
Summary Table: Revenue & Pricing Performance for Short-Term Summer Rentals
Bookings by OTA Channel
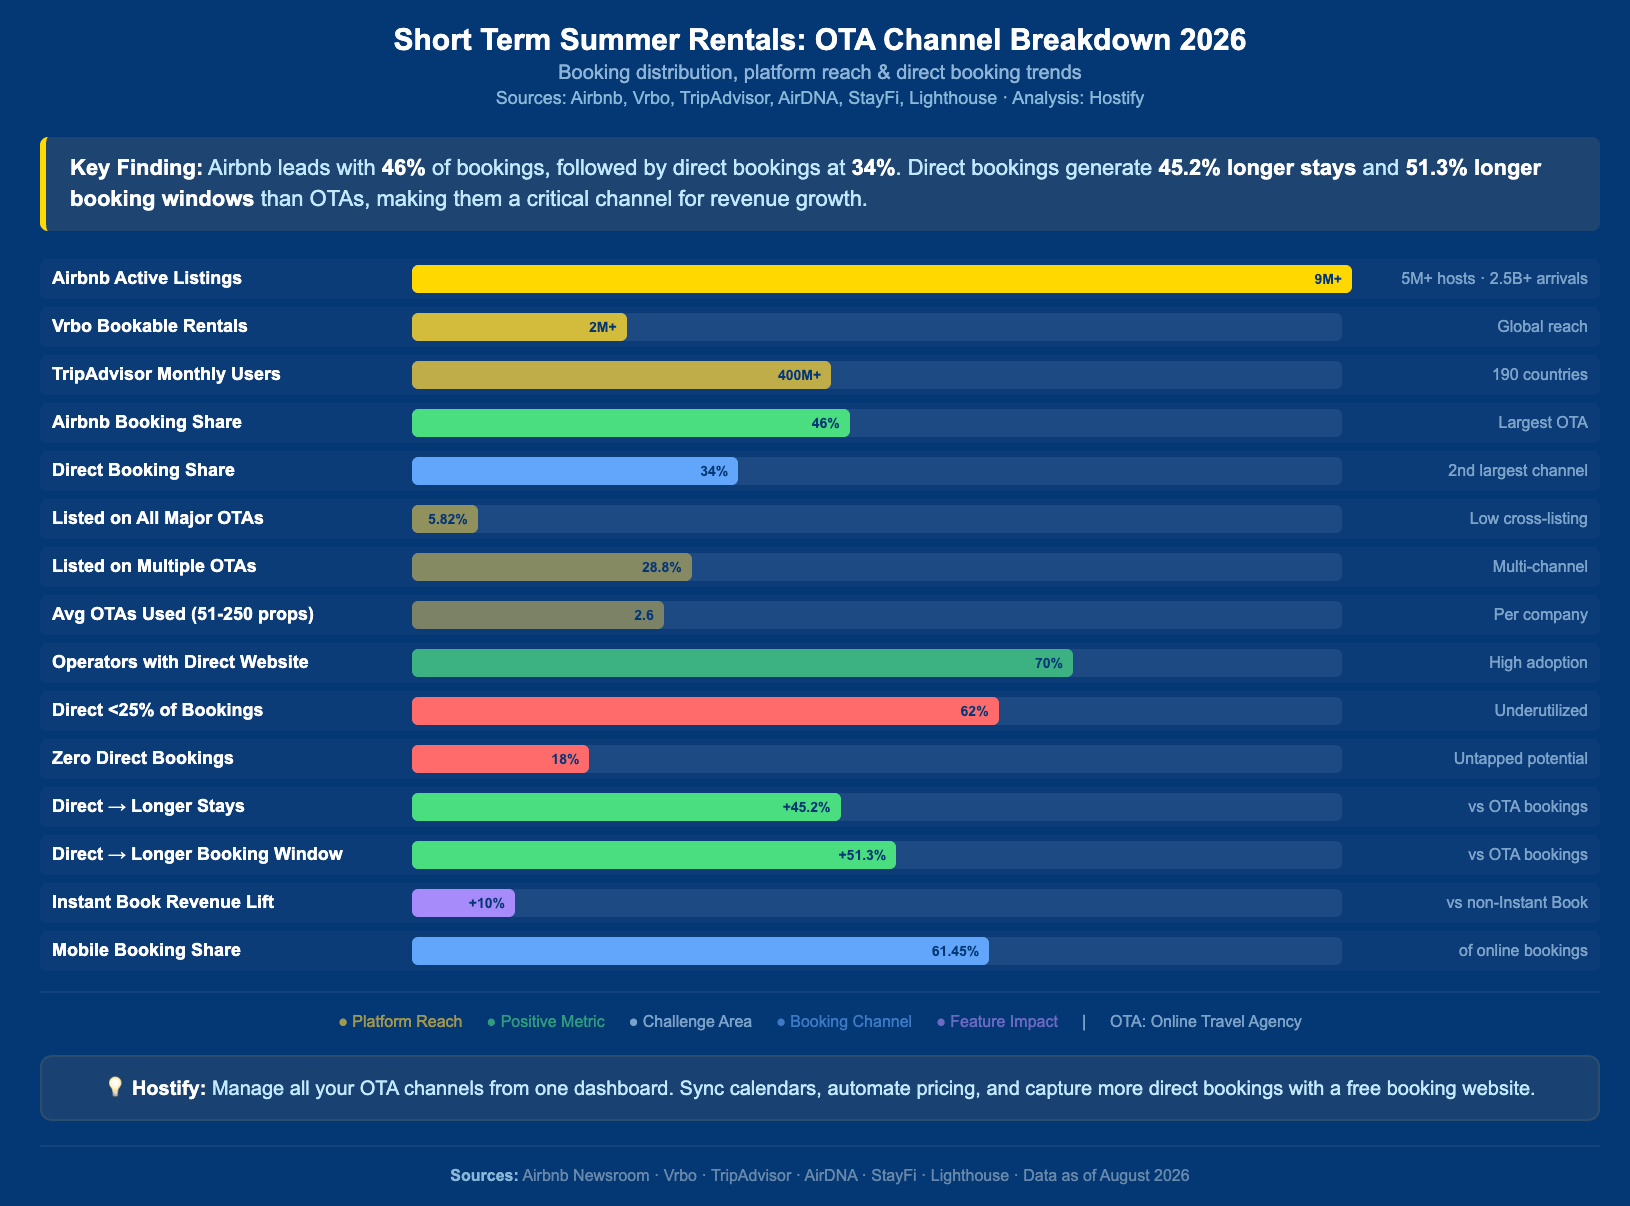
The distribution of bookings across online travel agencies (OTAs) reveals a clear leader in the short-term summer rentals space. Airbnb continues to dominate with 9 million active listings worldwide, over 5 million hosts, and more than 2.5 billion guest arrivals all-time. However, direct bookings are gaining ground, accounting for nearly 34% of bookings in 2024, second only to Airbnb’s 46% share.
Channel Market Share Breakdown
The OTA landscape for summer rentals is shaped by platform reach, fee structures, and guest preferences. Vacation rental companies managing 51-250 properties use an average of 2.6 OTA platforms to distribute their listings, while only 5.82% of rentals are listed on all major OTAs.
Key channel data for short-term summer rentals:
Guest Behavior & Booking Trends
Guest behavior in the short-term summer rentals market varies significantly by destination. According to AirROI pacing data from March 2026, fill rates for June across 10 major U.S. leisure markets ranged from 53% in Nags Head to just 17% in South Lake Tahoe. This 36-percentage-point spread reveals that demand is not uniform, and booking patterns depend heavily on market type, location, and traveler preferences.
Average Length of Stay
Length of stay is a critical metric for summer rentals, particularly in markets with high fill rates. Fast-filling markets like Nags Head (53% fill rate) and Hilton Head (34%) typically command longer stays, with hosts extending minimum stays to 5-7 nights during peak weeks. In slower markets like Myrtle Beach (19% fill rate), hosts are encouraged to reduce minimum stays to 2-3 nights to attract last-minute travelers.
Key length of stay insights:
- Fast-filling markets extend minimum stays to 5-7 nights for peak weeks
- Slow markets reduce minimum stays to 2-3 nights to attract bookings
Booking Window (Lead Time)
Booking windows for summer rentals vary significantly by market type. Coastal markets like the Gulf Coast typically see travelers booking 90-120 days in advance, while Cape Cod is a late-booking market where New England travelers book 60-75 days ahead. Gatlinburg bookings accelerate sharply inside the 45-day window, reflecting more spontaneous travel patterns in mountain destinations.
Key booking window insights:
- Gulf Coast beaches: 90-120 days advance booking
- Cape Cod: 60-75 days (late-booking market)
- Gatlinburg: Accelerates inside 45-day window
- Fast-filling markets fill inside 60 days at premium rates
Total Travelers
The rentals market continues to attract massive traveler demand. Global vacation rental users are estimated at 890 million in 2026, with projections reaching 1.11 billion by 2030. In the U.S., vacation rental users reached 62.89 million in 2026. Traveler preferences skew younger, with 62% of Gen Z and 60% of Millennials preferring vacation rentals over hotels. Large homes with 6+ bedrooms experienced the fastest booking growth at 12.61% year-over-year, driven by family and group travel, while 3-bedroom properties saw a strong 7.48% growth rate.
Key traveler data insights:
- Global vacation rental users in 2026: 890 million
- Projected users by 2030: 1.11 billion
- U.S. vacation rental users in 2026: 62.89 million
- Gen Z prefer vacation rentals: 62% vs 38% hotels
- Millennials prefer vacation rentals: 60% vs 40% hotels
- 6+ bedroom booking growth: +12.61% year-over-year
- 3-bedroom booking growth: +7.48% year-over-year
- Total nights booked in U.S. January 2026: +5.5% year-over-year

Summer 2026 Market Pacing Highlights
Summer 2026 rentals performance varied dramatically across U.S. markets. AirROI data shows June fill rates ranging from 53% in Nags Head to just 17% in South Lake Tahoe.
Fastest-Filling Markets
- United States: Nags Head (53% fill rate, $840/night ADR) and Hilton Head (34%, $694/night) lead the U.S., driven by strong coastal demand and limited supply.
- Latin America: Mexico’s World Cup host cities saw extraordinary demand. Monterrey recorded a 349% match-day ADR premium, while Guadalajara was the only host city with year-over-year occupancy growth, reaching 71% during key matches.
- Europe: France remains the largest European market with 213 million guest nights in 2025, followed by Spain (189M) and Italy (139M). Supply growth has moderated to 7.0% year-over-year.
- Asia-Pacific: The region is the fastest-growing globally with a 3.1% CAGR through 2033. Japan and Australia lead with strong demand, while China remains the second-largest market globally at $13.33 billion in revenue.
World Cup 2026 Impact
The 2026 FIFA World Cup generated $1.33 billion in total short-term rental revenue across 16 host cities, an additional $276.7 million compared to 2025. 84% of that revenue lift came from rate increases, not additional bookings. For a complete breakdown of how the tournament reshaped the vacation rental market, read our full analysis on Airbnb FIFA World Cup 2026: Vacation Rental Market Insights.
Key World Cup data:
- ADR increased +109% across all host cities (U.S.: +102%, Mexico: +184%, Canada: +117%)
- $212 million in host earnings on Airbnb alone
- $1.2 billion in total spending by Airbnb guests
- Kansas City: +377% demand spike during Argentina match
- Dallas: +126% asking vs. booked gap (largest among host cities)
- Guadalajara: Only host city with year-over-year occupancy growth
- Jersey City/Newark: +125% bookings on match days (demand diverted from NYC)
- Airbnb searches in host cities surged +160% after the World Cup draw
- Boston generated $57 million in revenue during the tournament
Key Takeaways for Hosts & Managers
The data from this short-term summer rentals report reveals clear patterns that property managers can act on immediately. Success in 2026 depends on understanding your market’s pacing tier, pricing dynamically, and optimizing your distribution channels.
Key takeaways:
- Know your market tier. Fast-filling markets (above 30% fill rate) should hold or raise rates, while slow markets (below 20%) need to activate now with discounts and shorter minimum stays.
- Pricing power is real. 84% of the $276.7M revenue lift from the World Cup came from rate increases, not additional bookings.
- Direct bookings matter. They generate 45.2% longer stays and 51.3% longer booking windows than OTA bookings.
- Pet-friendly and luxury properties outperform. Pet-friendly rentals command $17.41 higher ADR, while luxury-tier ADR grew 5.23% year-over-year.
- Booking windows vary by market. Coastal markets book 90-120 days out, while mountain destinations fill inside 45 days.
- Technology is no longer optional. 61% of operators used AI in 2025, and dynamic pricing proved essential for capturing peak demand.
- Distribution matters. Only 5.82% of rentals are listed on all major OTAs. Multi-channel distribution captures more traveler segments.
Operate Your Properties Better with Hostify
Managing summer rentals across multiple OTAs and markets can be overwhelming, especially during peak seasons. Hostify is an all-in-one property management software designed to help rental owners and property managers automate processes, integrate data from multiple channels, and save hours every week. From channel management and unified inbox to smart automations and a free booking website, Hostify gives you everything you need to scale your business without adding operational complexity.
Whether you’re preparing for the next World Cup, a major festival, or your busiest summer season, Hostify helps you stay organized, maximize occupancy, and deliver a consistently excellent guest experience. With 24/7 premium support, no onboarding fees, and a 14-day money-back guarantee, there’s never been a better time to streamline your operations.
Ready to grow your short-term summer rentals business?
👉 Book a demo today and discover how Hostify can help you work smarter, not harder.
FAQs
Global vacation rental users reached 890 million in 2026, with total nights booked in the U.S. up 5.5% year-over-year in January alone. Europe recorded 951.6 million guest nights through major platforms in 2025, an 11.4% increase over 2024.
Airbnb led with 46% of bookings, followed by direct bookings at 34%. Vrbo and Booking.com captured the remaining share. Airbnb reports 9M+ active listings and 5M+ hosts worldwide.
U.S. ADR reached $246.62 in January 2026, up 3.6% year-over-year. Global ADR is forecast to rise 1.5% in 2026, with luxury-tier properties growing 5.23% while budget-tier ADRs declined 0.33%.
Booking windows vary by market. Coastal Gulf Coast markets book 90-120 days ahead, Cape Cod books 60-75 days out, and mountain destinations like Gatlinburg accelerate inside 45 days. Direct bookings have 51.3% longer windows than OTA bookings.